|
|
|
|
Understanding Disk Space Usage
Usually, you get the information on how disk space is used in your cluster with the
pstorage top
command. This command displays the following disk-related information: total space, free space, and allocatable space. For example:
# pstorage -c pcs1 top
connected to MDS#1
Cluster 'pcs1': healthy
Space: [OK] allocatable 180GB of 200GB, free 1.6TB of 1.7TB
...
In this command output:
-
1.7TB is the total disk space in the
pcs1cluster. The total disk space is calculated on the basis of used and free disk space on all partitions in the cluster. Used disk space includes the space occupied by all data chunks and their replicas plus the space occupied by any other files stored on the cluster partitions.Let us assume that you have a 100 GB partition and 20 GB on this partition are occupied by some files. Now if you set up a chunk server on this partition, this will add 100 GB to the total disk space of the cluster, though only 80 GB of this disk space will be free and available for storing data chunks.
-
1.6TB is the free disk space in the
pcs1cluster. Free disk space is calculated by subtracting the disk space occupied by data chunks and any other files on the cluster partitions from the total disk space.For example, if the amount of free disk space is 1.6 TB and the total disk space is 1.7 TB, this means that about 100 GB on the cluster partitions are already occupied by some files.
-
allocatable 180GB of 200GBis the amount of free disk space that can used for storing data chunks. See Understanding allocatable disk space below for details.
Understanding allocatable disk space
When monitoring disk space information in the cluster, you also need to pay attention to the space reported by the
pstorage top
utility as
allocatable
. Allocatable space is the amount of disk space that is free and can be used for storing user data. Once this space runs out, no data can be written to the cluster.
To better understand how allocatable disk space is calculated, let us consider the following example:
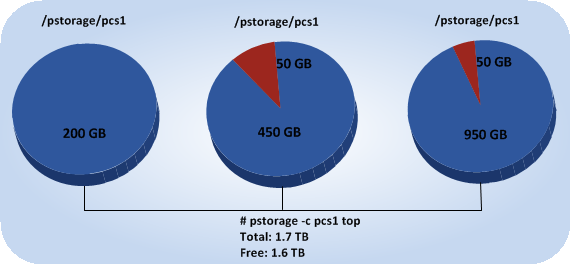
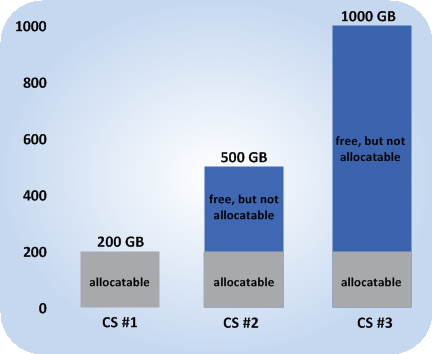
- The cluster has 3 chunk servers. The first chunk server has 200 GB of disk space, the second one — 500 GB, and the third one — 1 TB.
- The default replication factor of 3 is used in the cluster, meaning that each data chunk must have 3 replicas stored on three different chunk servers.
In this example, the available disk space will equal 200 GB — that is, set to the amount of disk space on the smallest chunk server:
# pstorage -c pcs1 top
connected to MDS#1
Cluster 'pcs1': healthy
Space: [OK] allocatable 180GB of 200GB, free 1.6TB of 1.7TB
...
This is explained by the fact that in this cluster configuration each server is set to store one replica for each data chunk. So once the disk space on the smallest chunk server (200 GB) runs out, no more chunks in the cluster can be created until a new chunk server is added or the replication factor is decreased.
If you now change the replication factor to 2, the
pstorage top
command will report the available disk space as 700 GB:
# pstorage set-attr -R /pstorage/pcs1 replicas=2:1
# pstorage -c pcs1 top
connected to MDS#1
Cluster 'pcs1': healthy
Space: [OK] allocatable 680GB of 700GB, free 1.6TB of 1.7TB
...
The available disk space has increased because now only 2 replicas are created for each data chunk and new chunks can be made even if the smallest chunk server runs out of space (in this case, replicas will be stored on a bigger chunk server).
Note: Allocatable disk space may also be limited by license.
Viewing space occupied by data chunks
To view the total amount of disk space occupied by all user data in the cluster, run the
pstorage top
command and press the V key on your keyboard. Once you do this, your command output should look like the following:
# pstorage -c pcs1 top
Cluster 'pcs1': healthy
Space: [OK] allocatable 180GB of 200GB, free 1.6TB of 1.7TB
MDS nodes: 1 of 1, epoch uptime: 2d 4h
CS nodes: 3 of 3 (3 avail, 0 inactive, 0 offline)
Replication: 2 norm, 1 limit, 4 max
Chunks: [OK] 38 (100%) healthy, 0 (0%) degraded, 0 (0%) urgent,
0 (0%) blocked, 0 (0%) offline, 0 (0%) replicating,
0 (0%) overcommitted, 0 (0%) deleting, 0 (0%) void
FS: 1GB in 51 files, 51 inodes, 23 file maps, 38 chunks, 76 chunk replicas
...
Note: The FS field shows the size of all user data in the cluster without consideration for replicas.
|
|
 Feedback
|