|
|
|
|
Monitoring Chunk Servers
By monitoring chunk servers, you can keep track of the disk space available in a Parallels Cloud Storage cluster. To monitor chunk servers, use the
pstorage -c
<cluster_name>
top
command, for example:
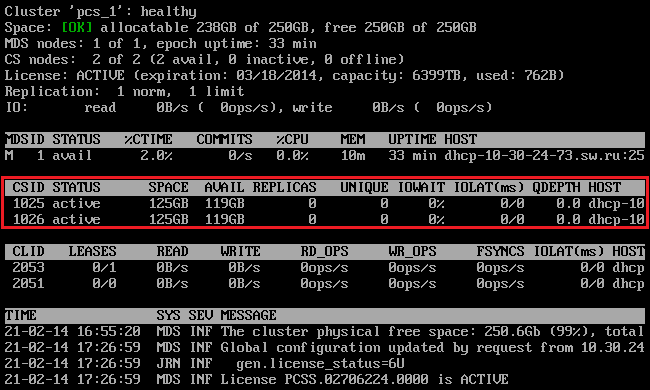
The command above shows detailed information about the
pcs1
cluster. The monitoring parameters for chunk servers (highlighted in red) are explained in the table below:
|
Parameter |
Description |
|
CSID |
Chunk server identifier (ID). |
|
STATUS |
Chunk server status:
|
|
SPACE |
Total amount of disk space on the chunk server. |
|
FREE |
Free disk space on the chunk server. |
|
REPLICAS |
Number of replicas stored on the chunk server. |
|
IOWAIT |
Percentage of time spent waiting for I/O operations being served. |
|
IOLAT |
Average/maximum time, in milliseconds, the client needed to complete a single IO operation during the last 20 seconds. |
|
QDEPTH |
Average chunk server I/O queue depth. |
|
HOST |
Chunk server hostname or IP address. |
|
FLAGS |
The following flags may be shown for active chunk servers:
Note : Flags which may be shown for failed chunk servers are described in Failed Chunk Servers . |
|
|
 Feedback
|