|
|
|
|
Viewing performance metrics
To view performance metrics, select the Monitoring category in the sidebar. The performance dashboard is shown in the right pane.
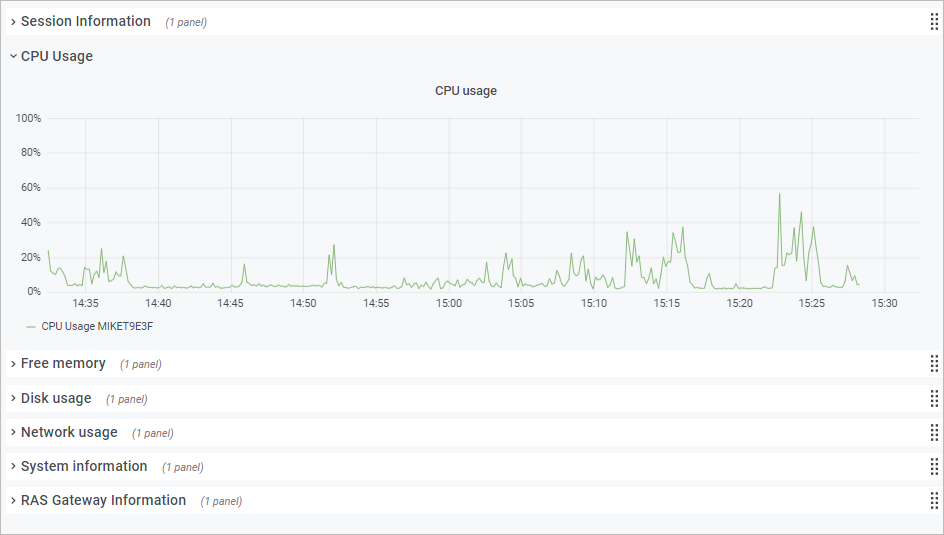
To view metrics of a specific type, expand the desired category in the main area of the dashboard. The categories include:
- Session Information . Displays the information about active sessions and disconnected sessions.
- CPU usage . CPU counters.
- Free memory . Physical memory counters.
- Disk usage . Disk I/O counters.
- Network usage . Network interface I/O counters.
- System information . System information counters.
- RAS Gateway information . RAS Gateway counters.
Performance metrics are displayed in the dashboard as a graph. Different counters are displayed using different colors.
To zoom in on a particular area of a graph, select a rectangular block with a mouse. You can also use the Zoom controls at the top of the dashboard for time range zoom out, shift time forward, or shift time backwards. To select a specific time range, click the "clock" icon at the top and then specify a time range.
By default, the dashboard opens in kiosk mode. To exist it, press "Esc". To cycle view mode, click the "monitor" icon in the upper right. When you exist kiosk mode, the RAS Infrastructure Health page is displayed:
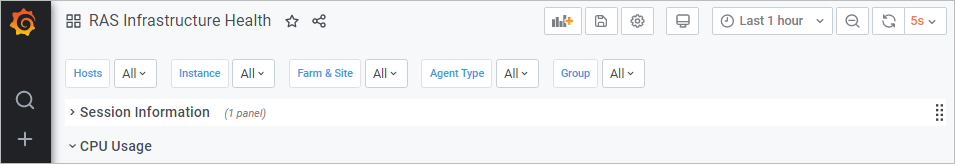
The menu at the top has the following items:
- Hosts . Allows you to select one or multiple servers for which the performance metrics should be displayed. To display the data for all servers in the Site, select All . Please note that if you don't see any servers in the list, you need to wait for Parallels RAS Performance Monitor to collect the initial set of statistics. This only happens on initial installation.
- Instance . This item allows you to select a specific counter instance (if there's more than one). For Network counters it is usually the name of a network interface. For Disk counters it is a disk name. Other types of counters don't usually have multiple instances.
- Farm & Site . Select a Site for which to display the data. Selecting All displays the data for all sites in the Farm. If you have another RAS Farm, and the RAS Performance Monitor is configured and enabled in it, you can also select a Site from that Farm.
- Agent Type . Select a RAS agent type.
- Group . Select an RDS group.
For more information about performance metrics and their meaning, please refer to the following articles from Microsoft:
- https://technet.microsoft.com/en-us/library/cc976785.aspx
- https://technet.microsoft.com/en-us/library/2008.08.pulse.aspx
See also RAS Performance Counters .
|
|