|
|
|
|
RAS Reports
The RAS Reporting functionality includes 14 predefined reports in 5 groups:
-
User Reports
. This group provides insight into how end users are interacting with Parallels RAS and includes the following reports:
- User activity - shows all sessions produced by all users in the system. Report includes information about each session; active time, idle time and disconnected time.
- User session activity - shows all sessions produced by a single user. Report includes information about each session; active time, idle time and disconnected time.
- Devices used by user - shows information about the devices being used by a user. Report includes information such as; device vendor, device model and total time used.
- Client operating system used by user - shows the operating system being used by a particular user; operating system, total time used.
-
Group Reports.
This group provides information about how groups of users are interacting with Parallels RAS and includes the following reports:
- Groups activity - shows all sessions produced by all groups in the system. Report includes information such as; active, idle and disconnected time.
- Group sessions activity - shows all sessions produced by a group in the system. Report includes information about each session produced by each user in the group such as; start, end, active, idle, disconnect and total time.
- Devices used by group - shows information about the devices being used by users that are members of a particular group. Report includes information such as; device vendor, model and total time used.
- Client operating system used by the group - shows the operating system being used by members of a particular group; operating system and total time used.
-
Devices Reports
. This group provides information about the devices that are connecting to Parallels RAS and includes the following reports:
- Devices used - shows all devices using the system. Report includes information such as; manufacturer, model and the number of sessions opened by the device.
- Client operating system used - shows devices and corresponding operating systems that are using the system. Report includes information such as; device model, operating system and amount of devices.
- RDP version used - shows the Parallels Client version , the device using that version and how many of those devices are being used.
-
Server Reports
. This group provides information about activity about the Parallels RAS server components and includes the following reports:
- Sessions activity on server - shows the session activity of users on a particular server. Report includes information such as; start, end, active, idle and disconnect time.
- Server health by server - shows server CPU and RAM usage for a particular server in a graph.
-
Application Reports
. This group provides information about the applications used with Parallels RAS and includes the following report:
- Applications usage - shows information about the applications used in the system. Report includes information such as; application name, number of times used and the total time the application was used for.
Note: The first time the reports are viewed, you may be requested to add http://<server domain/ IP> as a trusted website. This will appear depending on the Parallels RAS machine’s "Internet Explorer Enhanced Security Configuration".
To use RAS Reporting, select the Reporting category in the RAS Console.
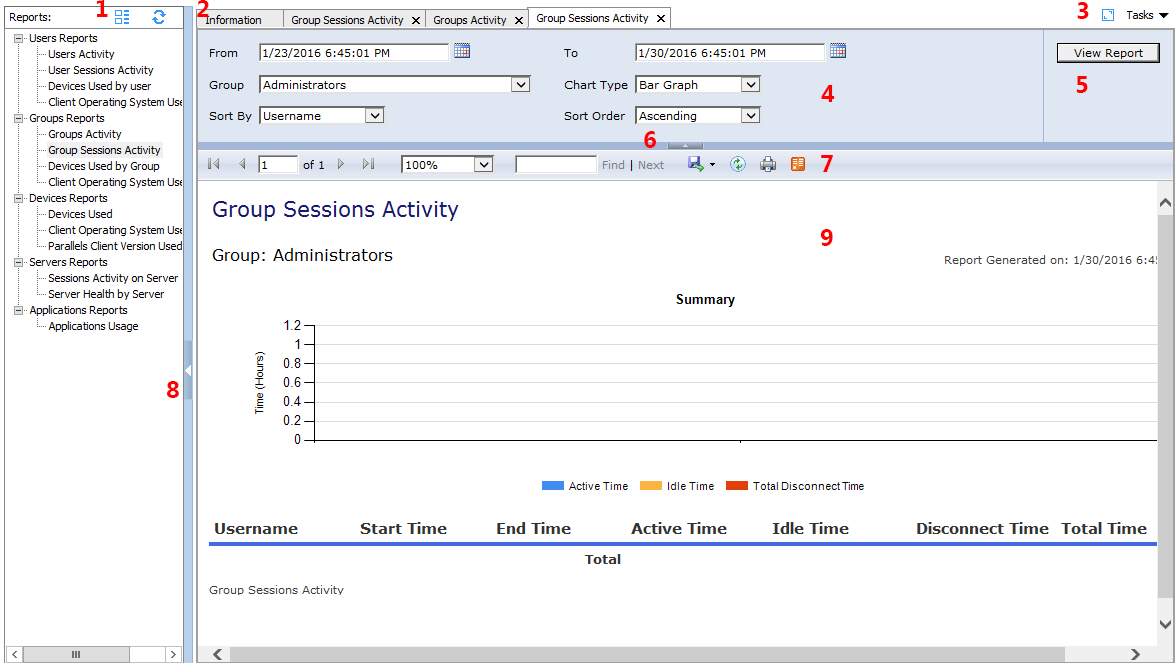
The reporting interface consists of useful tools which are split into sections as described below:
- Remove group nodes and refresh the list of reports available below.
- Reports generated are retained as tabs shown in this section. Click a tab to review the report generated and even cancel a tab to close a report.
- The blue button expands the reporting interface into full screen, while the Tasks drop-down menu allows you to apply the following actions to reports: Duplicate , Full screen , Close report , Close other reports , Close reports on the right , and Close all reports .
- This section lists the arguments available to apply constraints to reports such as the time frame the report will cover and chart type. These change depending on the report selected.
- The View Report button applies the constraints set in the section 4 to generate the report.
- Click this arrow to collapse sections 4 and 5.
- From this section, refresh the report, print the report, export the report to a data feed, or save the report in any of the following formats; XML, CSV, PDF MHTML, TIFF and Word.
- Click this arrow to collapse the reports listing.
- This section displays the new report dialog or old report selected in section 2.
Note: Parallels RAS reporting requires MS SQL Server and the Reporting Service installed and configured.
|
|
 Feedback
|